The housing market continues to impress, even as it enters the colder months, which is traditionally real estate’s slow season. After falling to a near-decade low in May due to pandemic-driven pressures, existing-home sales hit a 14-year high in October. In November, our measure of the market potential for existing-home sales increased 10 percent, compared with one year ago, to a 6.05 million seasonally adjusted annualized rate (SAAR) of sales. While the housing market rebound has been nothing short of incredible, the forces driving the rebound existed prior to the pandemic. Looking ahead, the good news for housing market potential is these fundamental forces are likely to remain constant throughout 2021.
“Strong underlying fundamentals shaped the housing market’s remarkable 2020 comeback story, helping overcome the pandemic-driven spring slowdown and ultimately fueling a record-breaking year. Add a vaccine to the story, and the stage is set for another strong year in 2021.”
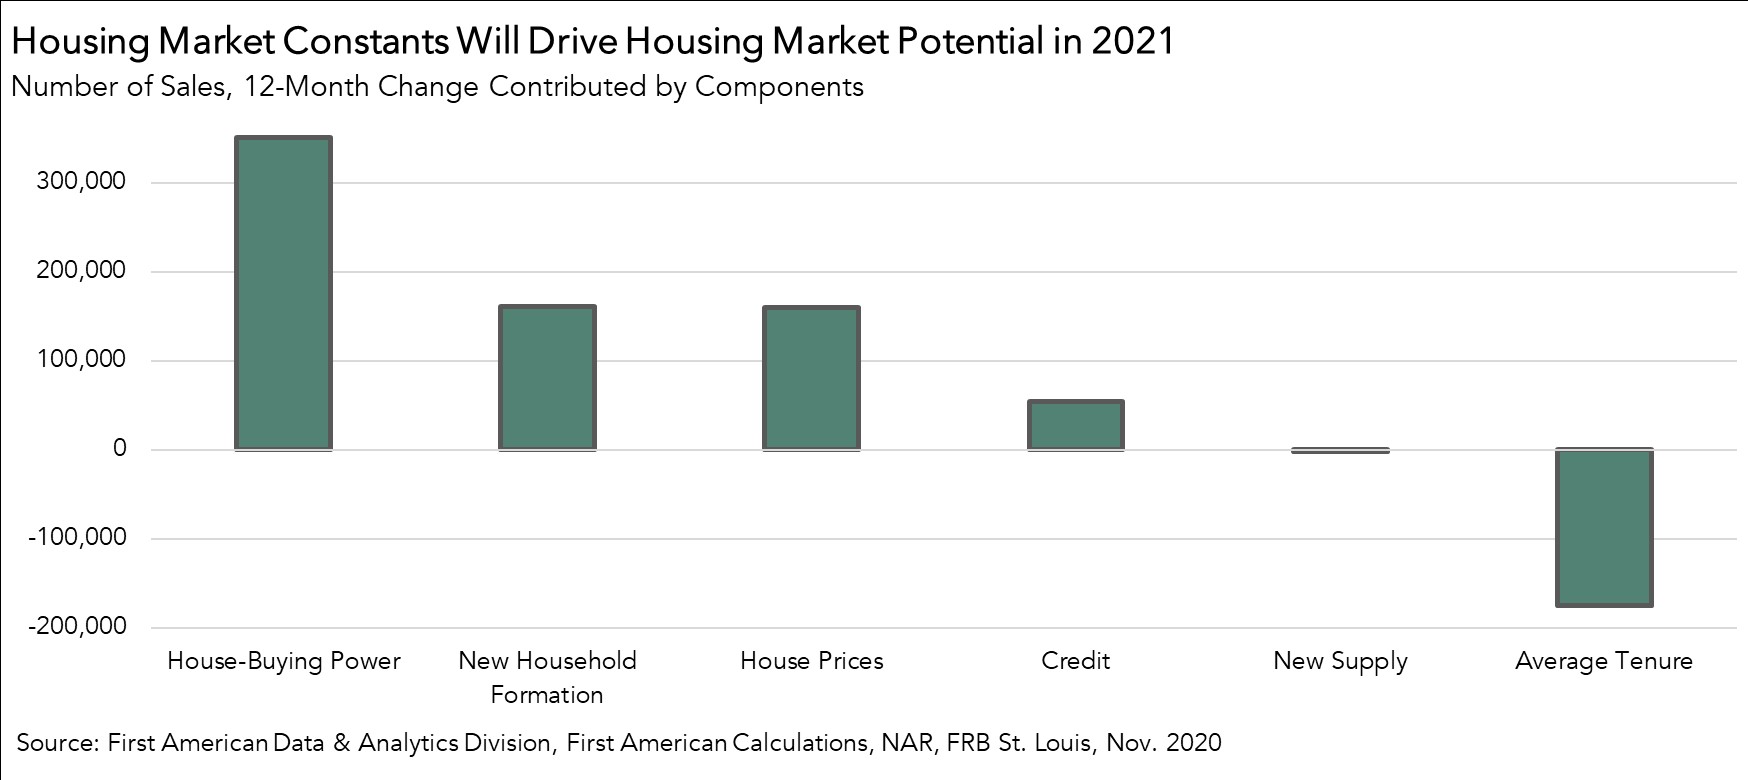
The Housing Markets Constants
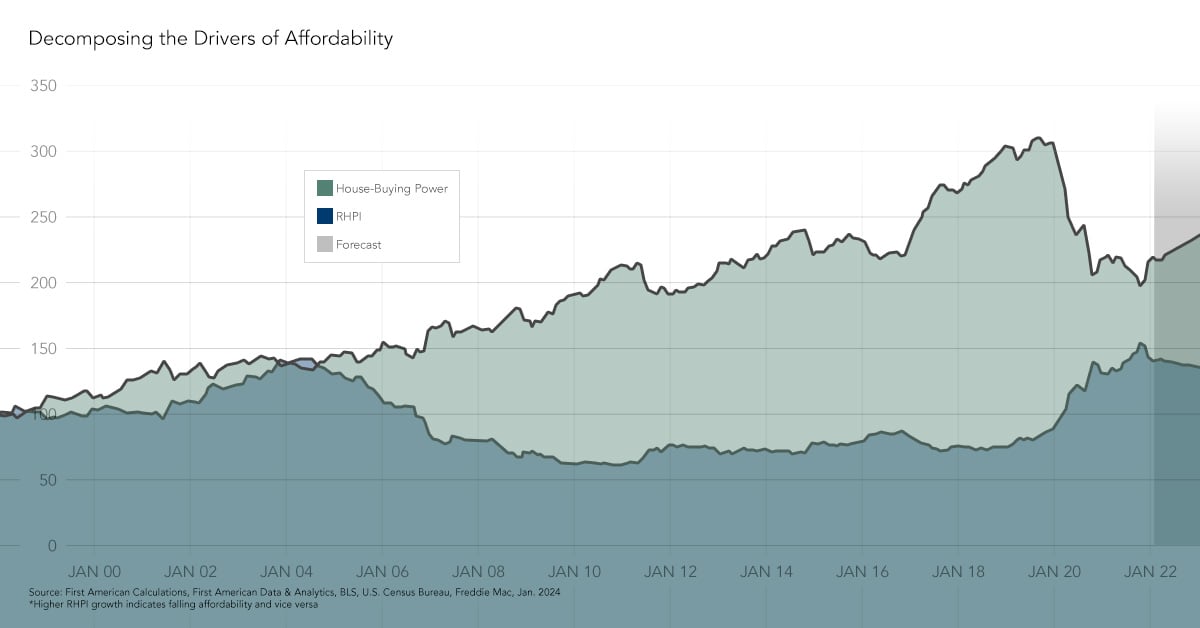
- Rising House-Buying Power: How much home one can afford to buy given their income and the prevailing mortgage rate is a primary driver of home-buying demand. Compared with one year ago, falling mortgage rates and rising incomes for those still employed resulted in nearly more 352,000 potential home sales. Consensus forecasts estimate the 30-year, fixed mortgage rate will likely average 3 percent next year, with forecasts ranging from 2.8 percent to 3.3 percent, so house-buying power is expected to remain strong in 2021 and continue to drive demand for homes.
- Millennial Demand: Household formation contributed to a gain of approximately 161,000 potential home sales in November relative to one year ago. The homeownership rate has been steadily rising since 2016, mostly due to millennial household formation. The bulk of millennials turned 30 this year and are beginning to age into their prime home-buying years, a demographic tailwind that will continue to boost housing market potential for years to come.
- Limited Supply of Homes for Sale: New- and existing-home inventory sits at historical lows. Tenure length, the average length of time someone lives in their home, continues to rise, reaching a historically high level of 10.5 years in November. The increase in tenure length reduced the potential for existing-home sales by nearly 175,000 in November. Rising tenure length means fewer and fewer people are listing their homes for sale, keeping housing supply tight. Additionally, the lack of new construction in November contributed to a loss of approximately 1,600 potential home sales relative to one year ago. While builders are working hard to deliver more supply to meet rising demand, it will take years to make up the decade-long gap. Fewer existing homeowners listing their homes for sale and a new-home construction deficit means the limited supply of homes for sale will remain another 2021 constant.
- Rapid House Price Appreciation: Strong demand from home buyers armed with robust buying power combined with limited supply results in heightened competition and bids up prices, a dynamic that defined the housing market in 2020. Faster house price appreciation resulted in a gain of approximately 160,000 potential home sales in November due to rising equity levels. As homeowners gain equity in their homes, they are more tempted to consider using the equity to purchase a larger or more attractive home. The allure of the more attractive house can help encourage more homeowners to list their homes for sale. This partially explains why home sales in the highest price tiers experienced the greatest year-over-year growth in October. Since the supply and demand dynamics will continue in 2021, we expect to see continued house price appreciation.
The Question Mark
- Credit Conditions: When lending standards are tight, fewer people can qualify for a mortgage, resulting in less first-time home buyer demand and increasing the likelihood that some homeowners stay in their current homes because they are ineligible for a new mortgage. When the pandemic hit, lenders tightened their lending criteria to protect against the potential for increased delinquencies. At the height of the pandemic-driven housing market contraction in April, tight credit conditions reduced the potential for existing-home sales by over 900,000 sales relative to a year ago. As the uncertainty has subsided, credit conditions have loosened. In November, looser credit conditions increased potential home sales by 54,000 relative to one year ago. What lending standards will look like in 2021 remains unclear and will depend on economic conditions in the coming months.
The Housing Market’s 2020 Tailwinds Will Carry Through to 2021
The potential for a successful vaccine rollout in the first half of 2021 bodes well for the economic recovery in the second half of 2021. But, first, we need to get through the winter, luckily a time when the housing market is usually slow. The good news is that housing market constants – low rates, limited supply and demographic demand – are exactly that, constants. Strong underlying fundamentals shaped the housing market’s remarkable 2020 comeback story, helping overcome the pandemic-driven spring slowdown and ultimately fueling a record-breaking year. Add a vaccine to the story, and the stage is set for another strong year in 2021.
November 2020 Potential Home Sales
For the month of November, First American updated its proprietary Potential Home Sales Model to show that:
- Potential existing-home sales increased to a 6.05 million seasonally adjusted annualized rate (SAAR), a 3.0 percent month-over-month increase.
- This represents a 73.5 percent increase from the market potential low point reached in February 1993.
- The market potential for existing-home sales increased 10.0 percent compared with a year ago, a gain of nearly 551,135 (SAAR) sales.
- Currently, potential existing-home sales is 743,100 million (SAAR), or 10.9 percent below the pre-recession peak of market potential, which occurred in April 2006.
Market Performance Gap
- The market for existing-home sales outperformed its potential by 1.4 percent or an estimated 84,262 (SAAR) sales.
- The market performance gap increased by an estimated 16,847 (SAAR) sales between October 2020 and November 2020.
First American Deputy Chief Economist Odeta Kushi contributed to this post.
What Insight Does the Potential Home Sales Model Reveal?
When considering the right time to buy or sell a home, an important factor in the decision should be the market’s overall health, which is largely a function of supply and demand. Knowing how close the market is to a healthy level of activity can help consumers determine if it is a good time to buy or sell, and what might happen to the market in the future. That is difficult to assess when looking at the number of homes sold at a particular point in time without understanding the health of the market at that time. Historical context is critically important. Our potential home sales model measures what we believe a healthy market level of home sales should be based on the economic, demographic and housing market environments.
About the Potential Home Sales Model
Potential home sales measures existing-home sales, which include single-family homes, townhomes, condominiums and co-ops on a seasonally adjusted annualized rate based on the historical relationship between existing-home sales and U.S. population demographic data, homeowner tenure, house-buying power in the U.S. economy, price trends in the U.S. housing market, and conditions in the financial market. When the actual level of existing-home sales are significantly above potential home sales, the pace of turnover is not supported by market fundamentals and there is an increased likelihood of a market correction. Conversely, seasonally adjusted, annualized rates of actual existing-home sales below the level of potential existing-home sales indicate market turnover is underperforming the rate fundamentally supported by the current conditions. Actual seasonally adjusted annualized existing-home sales may exceed or fall short of the potential rate of sales for a variety of reasons, including non-traditional market conditions, policy constraints and market participant behavior. Recent potential home sale estimates are subject to revision to reflect the most up-to-date information available on the economy, housing market and financial conditions. The Potential Home Sales model is published prior to the National Association of Realtors’ Existing-Home Sales report each month.